전글 Loki 최신 버전 설치하기에서 인덱스 DB를 Dynamodb로 연동하지 못했다. 미련이 남아 스터디가 끝난 이후에도 여러 테스트를 해보았고, 마침내 연동을 성공하여 관련 경험을 공유한다.

먼저, Loki에서 DynamoDB로 연동해야 하는 목적부터 알고 가자. 배경 지식 설명을 위해 Loki 의 지원 스토리지를 다시 확인하겠다.

<a href="https://grafana.com/docs/loki/latest/operations/storage/">https://grafana.com/docs/loki/latest/operations/storage/</a>

https://grafana.com/docs/loki/latest/operations/storage/

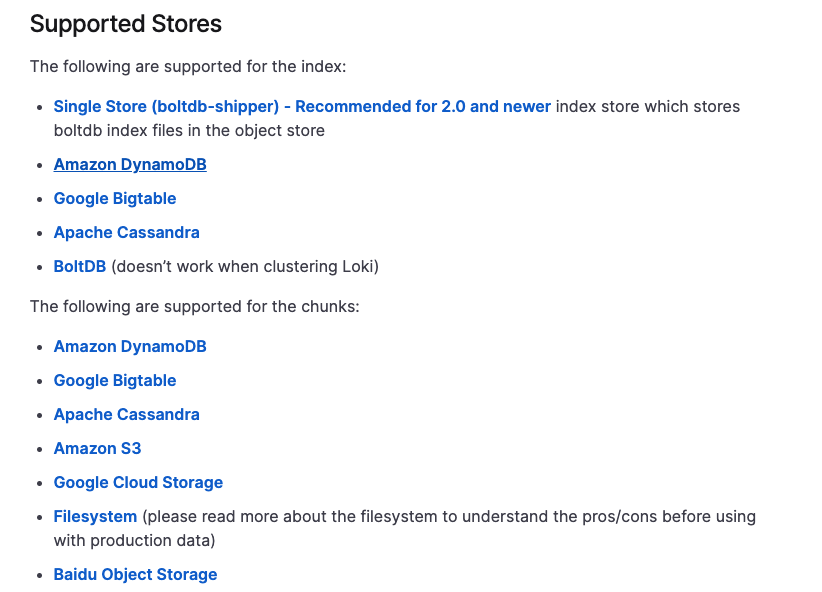
스토리지 연동 목록을 살펴보면 Loki 2.0 이상에서 싱글 스토어(boltdb-shipper)가 추가되었고 연동으로 추천하고 있다. (기본 스토리지도 싱글 스토어이다.) 이유를 살펴보니 비용 감소인데 로컬에서 인덱스를 저장하기 때문에 외부 스토리지에 대한 종속성이 줄기 때문이라 한다. 다만, 원격 저장소로 백업하고 복원하는데 추가 작업이 필요하다. (앞 글에서는 S3로 연동했으나 시간 텀이 15분 정도 있었음)

비용은 발생하지만, DyanmoDB 연동 목적은 다음과 같다.

  • 복원력 : 실시간으로 데이터가 적재되어 로키 파드가 죽어도 데이터가 유지된다.
  • 확장성 : 멀티 클러스터에서의 실시간 로깅 확인 (로컬인 경우 S3에 적재가 가능하지만 시간 텀이 있다.)

결론적으로, 소규모 프로젝트나 초기 설정에 초점을 맞추는 경우 BoltDB & S3 옵션을 고려할 수 있다. 반면, 대규모 프로젝트나 장기적인 운영에 초점을 맞추는 경우 S3 & DynamoDB 옵션이 더 적합하다.

연동 트러블슈팅

DynamoDB 연동을 위해 해결했던 문제점은 두가지였다. 항목별로 살펴보겠다.

  • Helm Value Override 문제
  • Loki 스토리지 연동 설정 문제

Helm Value Override 문제

지난 글에서 스토리지 설정을 S3 및 기타 스토리지로 설정했음에도 기본 스토리지 (boltdb & snipper) 가 설정되어 관련 문제를 확인하였다. helm template 명령어를 통해서 스토리지 차트 랜더링을 확인하니 Values 오버라이드 값이 아닌 기본 값(boltdb & snipper)이 입력되어 있는 것을 확인할 수 있다.

1
helm template loki grafana/loki  -f loki.yaml -n loki --version 4.8.0 > result.yaml
 1
 2
 3
 4
 5
 6
 7
 8
 9
10
11
12
13
14
15
16
17
18
19
20
21
22
23
24
25
26
27
28
29
30
31
32
33
34
35
36
37
38
39
40
41
42
43
44
45
46
47
48
49
50
51
52
53
54
55
56
57
58
59
60
61
62
63
64
# Source: loki/templates/configmap.yaml
apiVersion: v1
kind: ConfigMap
metadata:
  name: loki
  labels:
    helm.sh/chart: loki-4.8.0
    app.kubernetes.io/name: loki
    app.kubernetes.io/instance: loki
    app.kubernetes.io/version: "2.7.3"
    app.kubernetes.io/managed-by: Helm
data: # override 적용 안된다! 
  config.yaml: |
    auth_enabled: false
    common:
      compactor_address: 'loki-read'
      path_prefix: /var/loki
      replication_factor: 3
      storage:
        s3:
          bucketnames: chunks
          insecure: false
          s3forcepathstyle: false
    limits_config:
      enforce_metric_name: false
      max_cache_freshness_per_query: 10m
      reject_old_samples: true
      reject_old_samples_max_age: 168h
      split_queries_by_interval: 15m
    memberlist:
      join_members:
      - loki-memberlist
    query_range:
      align_queries_with_step: true
    ruler:
      storage:
        s3:
          bucketnames: ruler
          insecure: false
          s3forcepathstyle: false
        type: s3
    runtime_config:
      file: /etc/loki/runtime-config/runtime-config.yaml
    schema_config:
      configs:
      - from: "2022-01-11"
        index:
          period: 24h
          prefix: loki_index_
        object_store: s3
        schema: v12
        store: boltdb-shipper
    server:
      grpc_listen_port: 9095
      http_listen_port: 3100
    storage_config:
      hedging:
        at: 250ms
        max_per_second: 20
        up_to: 3
    table_manager:
      retention_deletes_enabled: false
      retention_period: 0    
---
  • 스토리지 연동 부분인 data.config.yaml.schema_config 와 data.config.yaml.storage_config 에 기본 값이 적용되어 있는 것을 확인할 수 있다.

원인은 Loki 헬름 차트에서 if 문법과 override 값에서 생긴 랜더링 문제로 확인된다. 관리성 문제로 overrider 파일의 값을 적용시키려 했지만, 적용되지 않았다. (헬름 차트에 정확한 순서 및 문법을 검사했음에도..)

우회적 해결 방법으로 기본 차트 vaules.yaml 에 값을 직접 입력하였다.

 1
 2
 3
 4
 5
 6
 7
 8
 9
10
11
12
13
14
15
16
17
18
19
20
21
22
23
24
25
26
27
28
29
30
31
32
33
34
35
36
37
38
39
40
41
42
43
44
45
46
47
48
49
50
51
52
53
54
55
56
57
58
59
60
# vaule.yaml
Loki:
...
config: |
  ....  
	table_manager:
	      retention_deletes_enabled: true
	      retention_period: 336h
	      index_tables_provisioning:
	        provisioned_write_throughput: 5
	        provisioned_read_throughput: 5
	      chunk_tables_provisioning:
	        provisioned_write_throughput: 5
	        provisioned_read_throughput: 5
   ...
# vaule.yaml
Loki:
...
# -- Check https://grafana.com/docs/loki/latest/configuration/#schema_config for more info on how to configure schemas
  schemaConfig:
    configs:
    - from: "2022-01-11"
      store: aws
      object_store: s3
      schema: v12
      index:
        prefix: loki_
  # -- Check https://grafana.com/docs/loki/latest/configuration/#ruler for more info on configuring ruler
  rulerConfig: {}
  # -- Structured loki configuration, takes precedence over `loki.config`, `loki.schemaConfig`, `loki.storageConfig`
  structuredConfig: {}
  # -- Additional query scheduler config
  query_scheduler: {}
  # -- Additional storage config
  storage_config:
    hedging:
      at: "250ms"
      max_per_second: 20
      up_to: 3
    aws:
      s3: s3.ap-northeast-2.amazonaws.com
      bucketnames: han-loki
      region: ap-northeast-2
      access_key_id: <access-key> 
      secret_access_key: <aws-secret-key>
      dynamodb:
        dynamodb_url: dynamodb.ap-northeast-2.amazonaws.com
...
config: |
  ....  
	table_manager:
	      retention_deletes_enabled: true
	      retention_period: 336h
	      index_tables_provisioning:
	        provisioned_write_throughput: 5
	        provisioned_read_throughput: 5
	      chunk_tables_provisioning:
	        provisioned_write_throughput: 5
	        provisioned_read_throughput: 5
   ...

## Loki 스토리지 연동 설정 문제

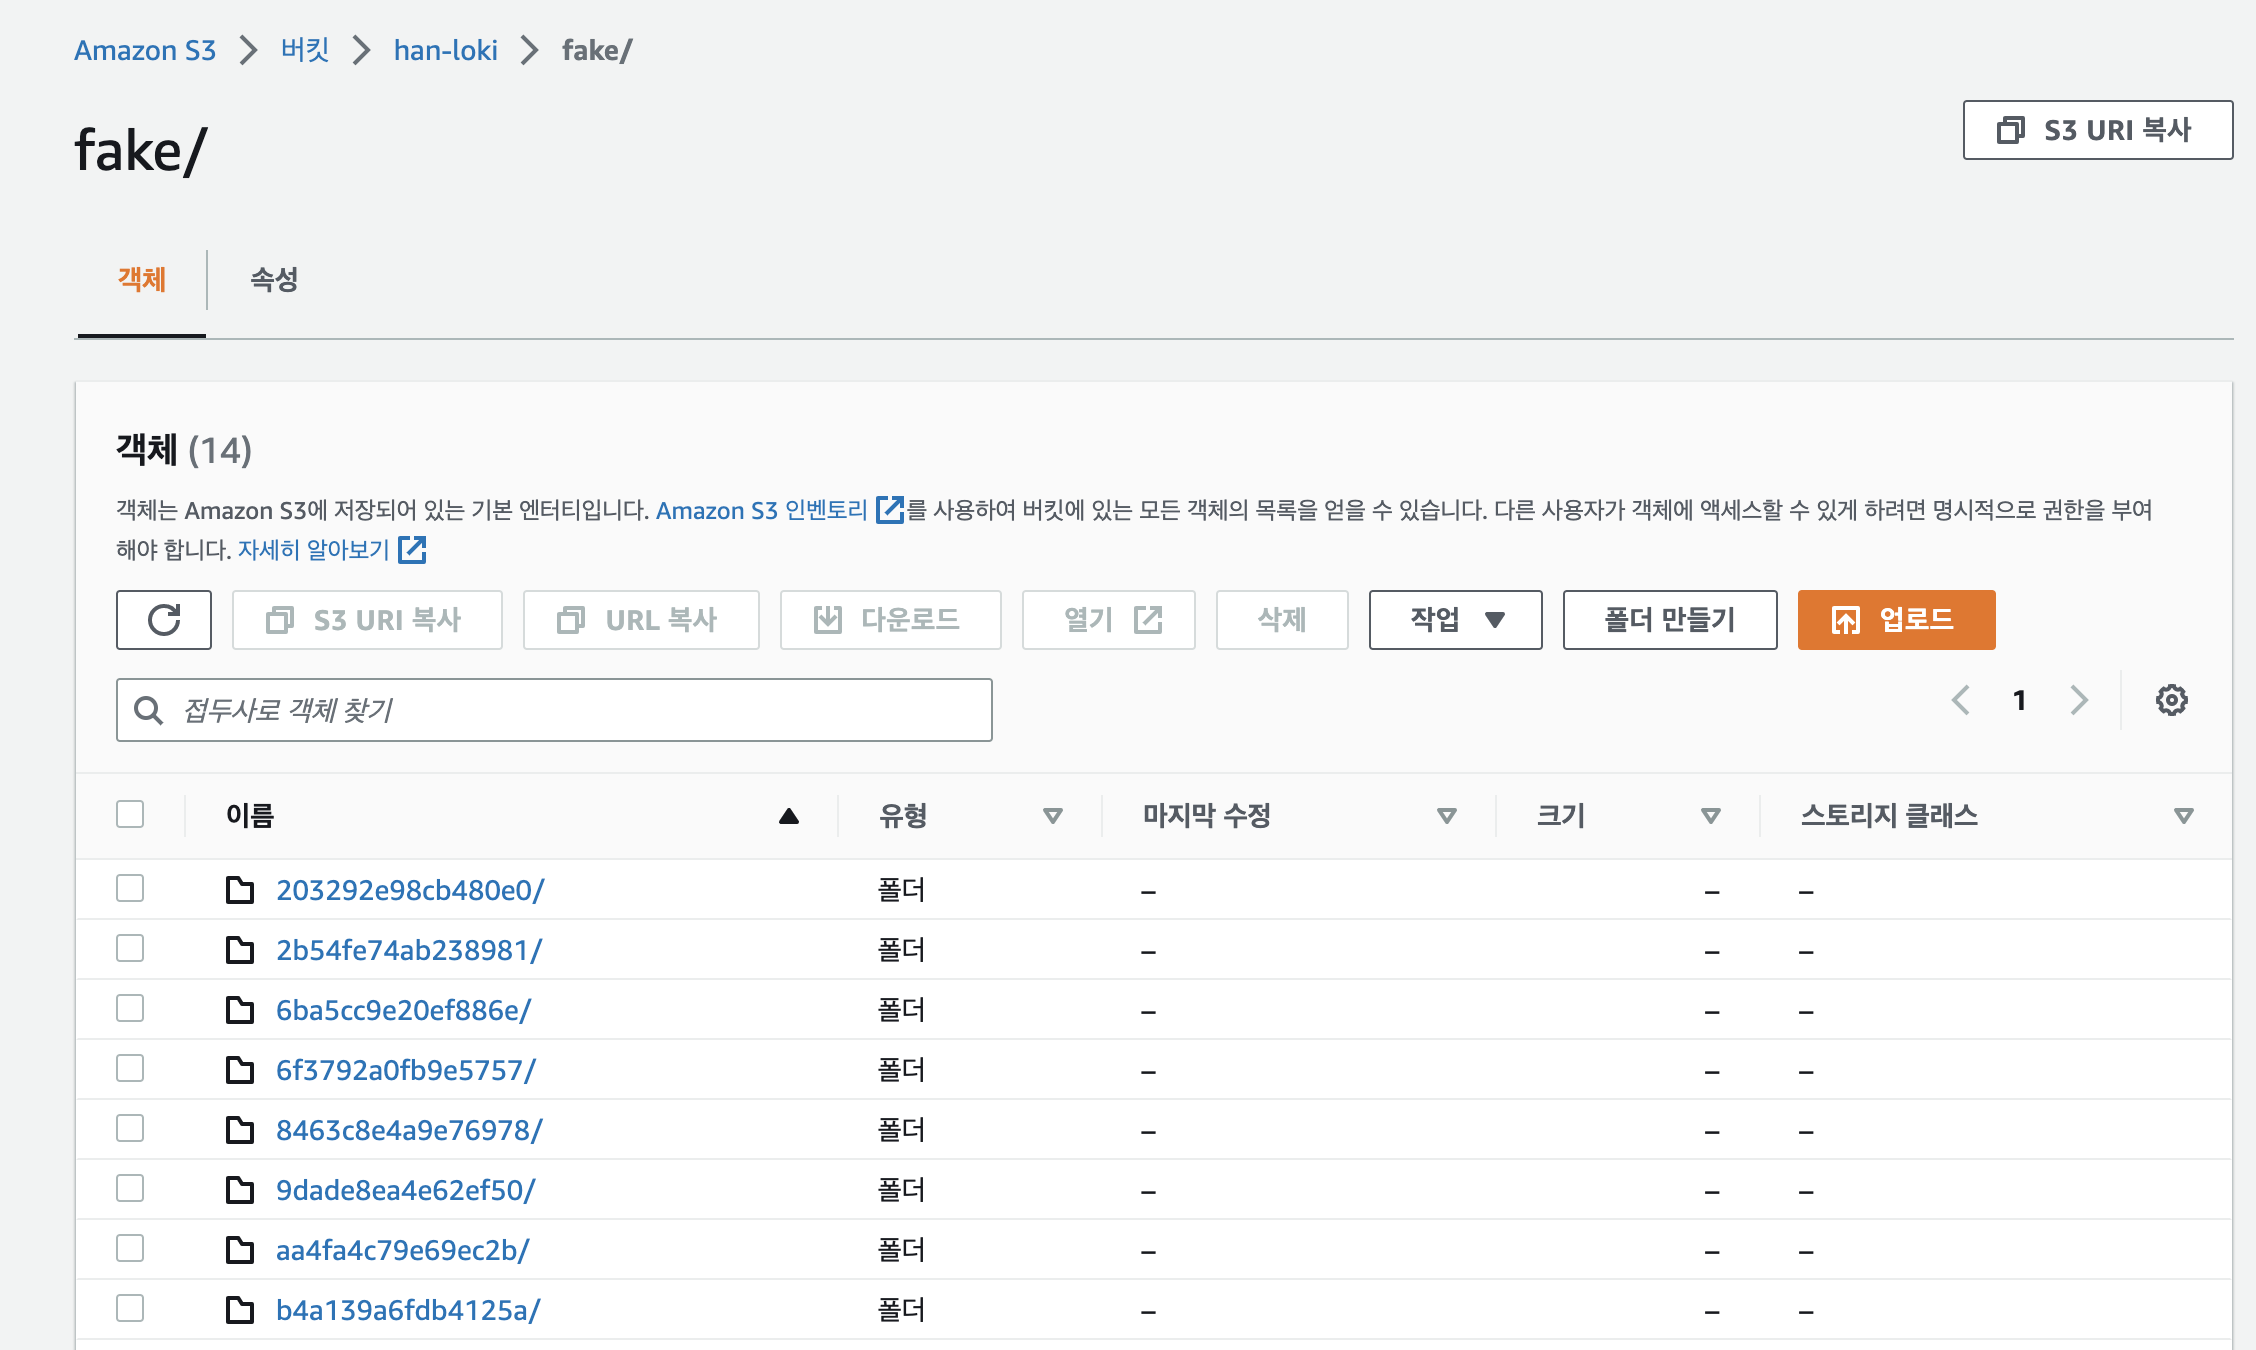
DynamoDB 스토리지로 선택이 되나, loki-read Pod에서 다음의 연동 오류가 발생한다.

```bash
level=info ts=2023-04-16T13:31:40.414190216Z caller=http.go:279 org_id=fake msg="ended tailing logs" tenant=fake selectors="{stream=\"stdout\",pod=\"loki-canary-c8s22\"}"
level=info ts=2023-04-16T13:31:50.419151688Z caller=http.go:276 org_id=fake msg="starting to tail logs" tenant=fake selectors="{stream=\"stdout\",pod=\"loki-canary-c8s22\"}"
level=error ts=2023-04-16T13:31:50.422289139Z caller=series_index_store.go:583 org_id=fake msg="error querying storage" err="QueryPages error: table=loki_: MissingRegion: could not find region configuration"
level=error ts=2023-04-16T13:31:50.422642663Z caller=series_index_store.go:583 org_id=fake msg="error querying storage" err="QueryPages error: table=loki_: MissingRegion: could not find region configuration"
level=info ts=2023-04-16T13:31:50.422757665Z caller=http.go:279 org_id=fake msg="ended tailing logs" tenant=fake selectors="{stream=\"stdout\",pod=\"loki-canary-c8s22\"}"
level=info ts=2023-04-16T13:32:00.112792136Z caller=http.go:276 org_id=fake msg="starting to tail logs" tenant=fake selectors="{stream=\"stdout\",pod=\"loki-canary-q52t8\"}"
level=error ts=2023-04-16T13:32:00.11538504Z caller=series_index_store.go:583 org_id=fake msg="error querying storage" err="QueryPages error: table=loki_: MissingRegion: could not find region configuration"
level=error ts=2023-04-16T13:32:00.115479121Z caller=series_index_store.go:583 org_id=fake msg="error querying storage" err="QueryPages error: table=loki_: MissingRegion: could not find region configuration"

해당 이슈는 Loki 깃허브에서 확인이 가능했으나 답변이 없었다.

<a href="https://github.com/grafana/loki/issues/1957">https://github.com/grafana/loki/issues/1957</a>

https://github.com/grafana/loki/issues/1957

원인은 Loki DynamoDB 스토리지 설정으로 생긴 문제였다. 깃 이슈를 확인하면 Loki 공식문서에서 제공하는 파라미터를 통해 설정한 것을 확인할 수 있었는데, 그대로 따라하면 오류가 발생한다.

<a href="https://grafana.com/docs/loki/latest/configuration/#aws_storage_config">https://grafana.com/docs/loki/latest/configuration/#aws_storage_config</a>

https://grafana.com/docs/loki/latest/configuration/#aws_storage_config

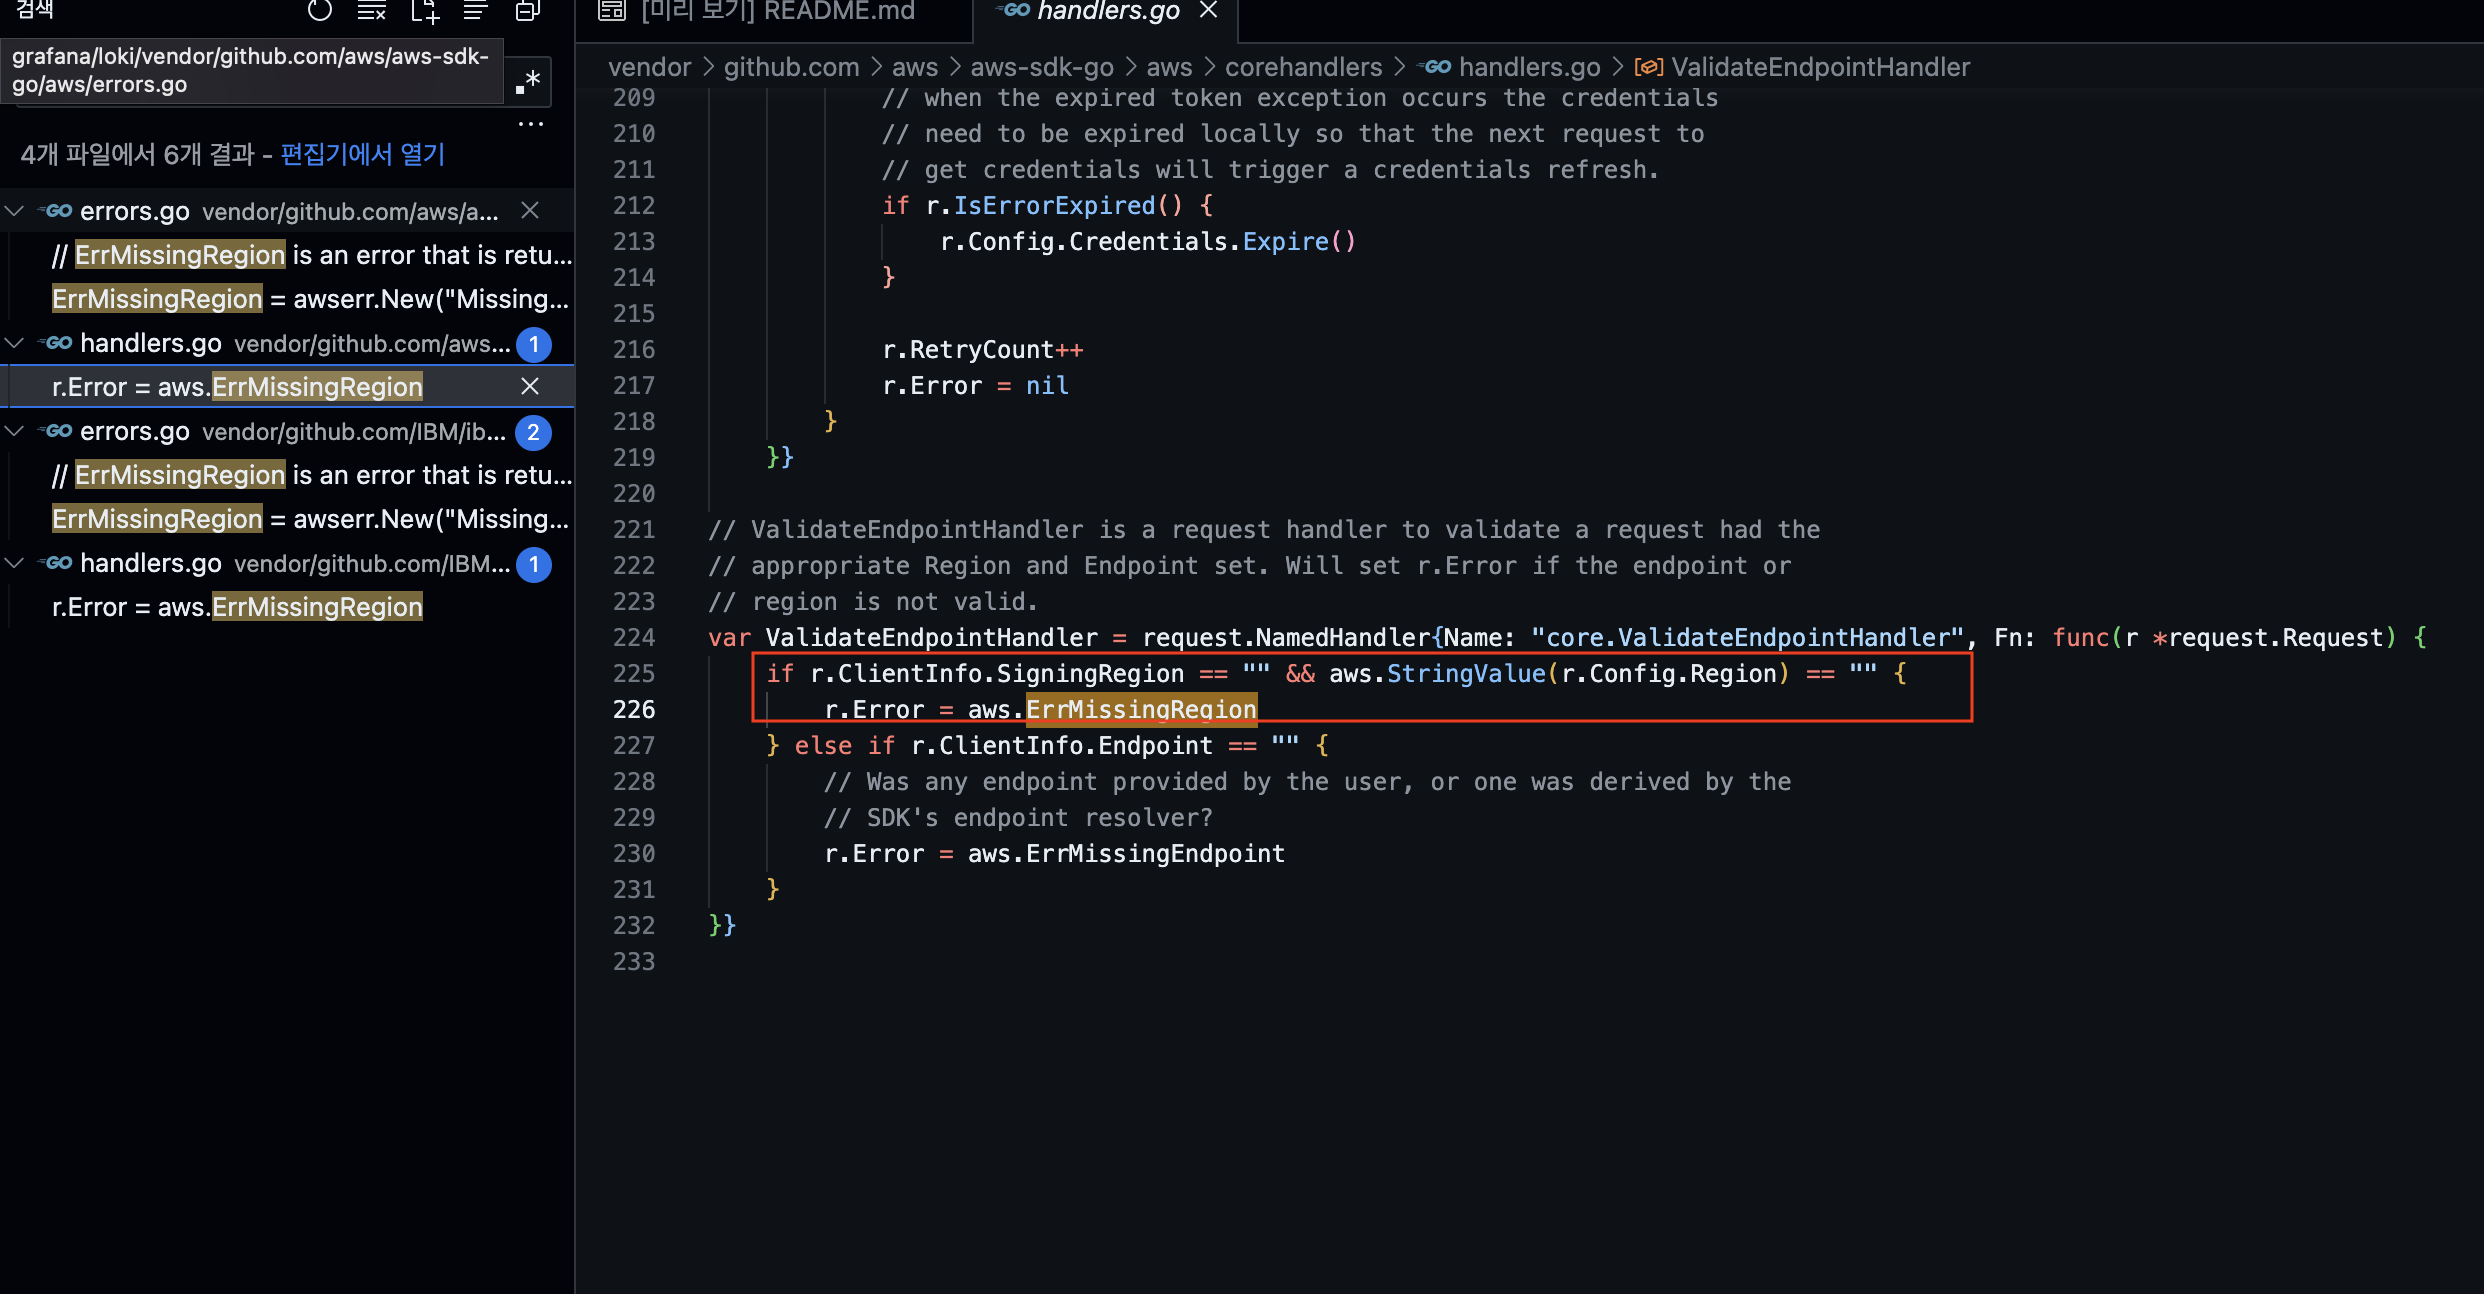
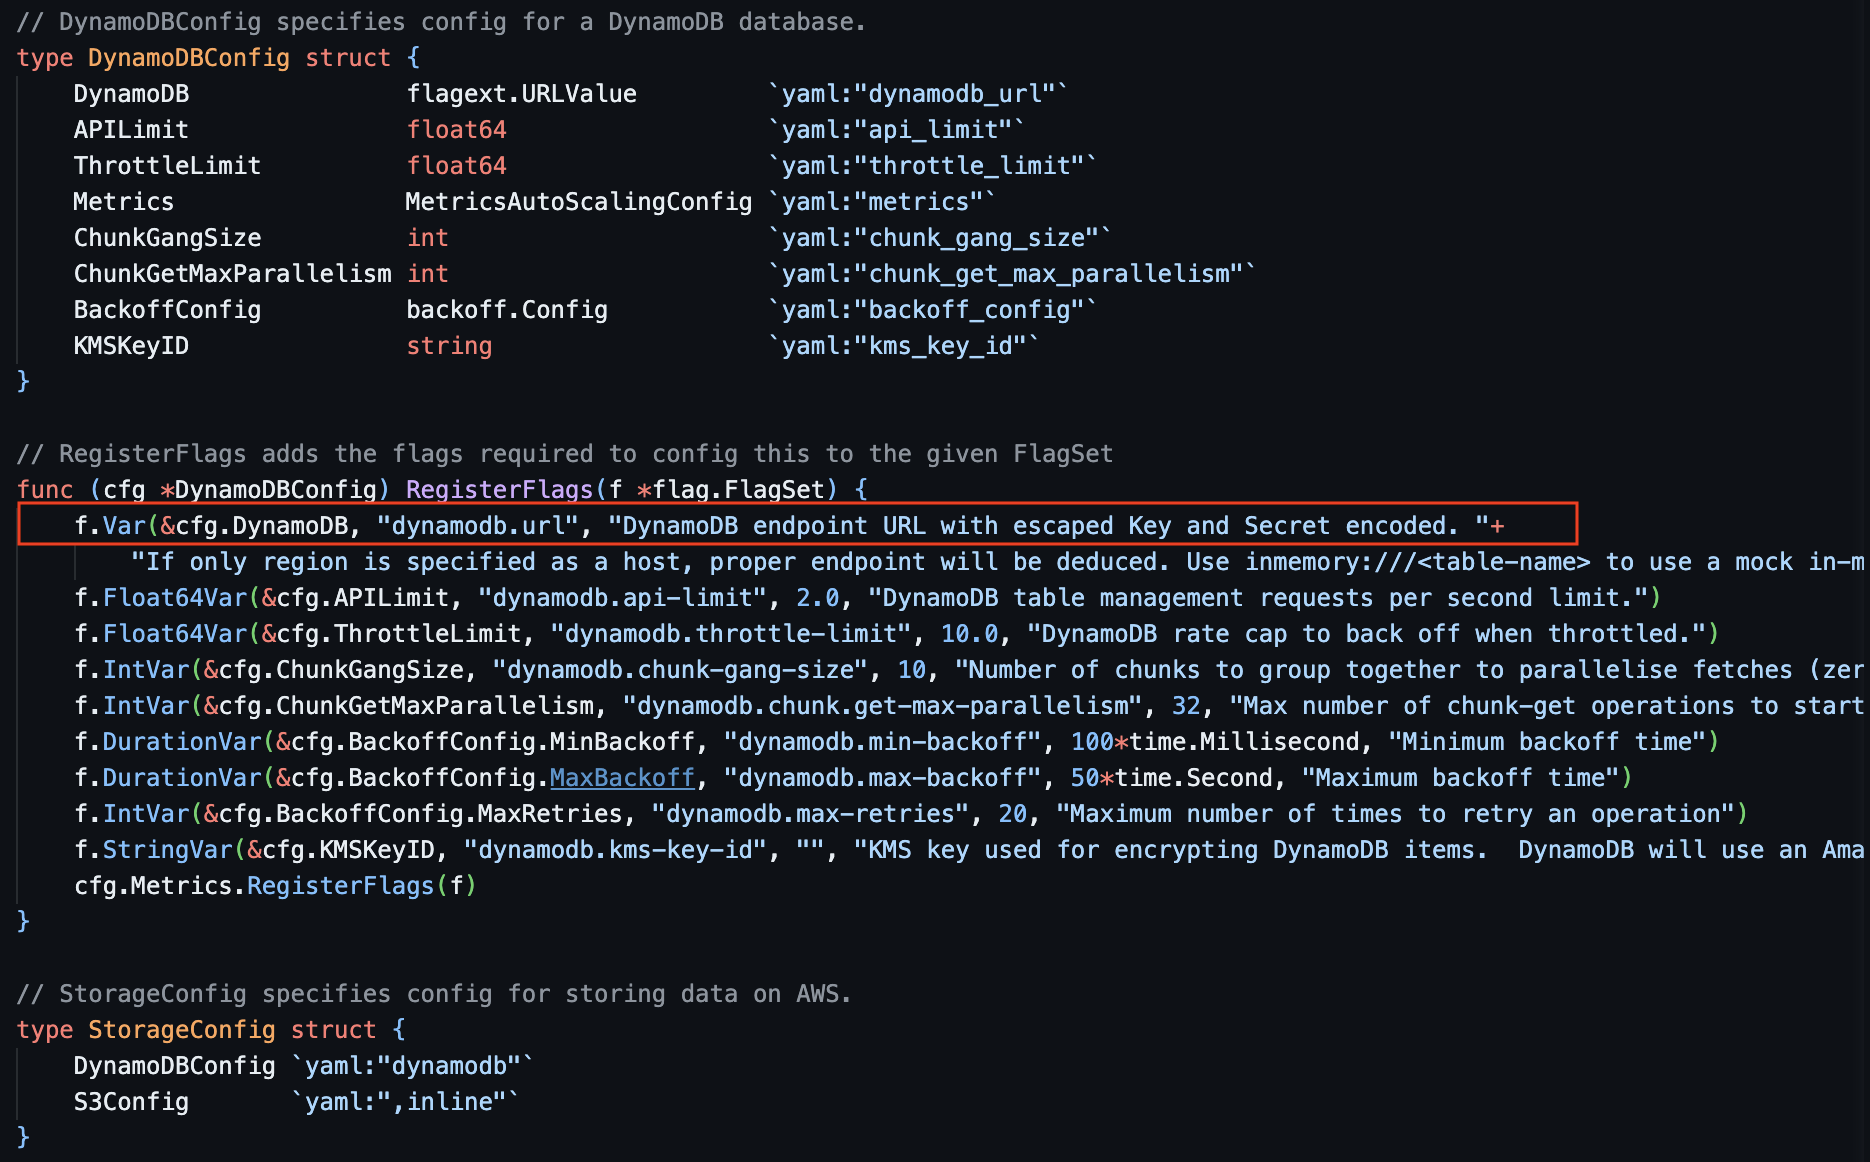
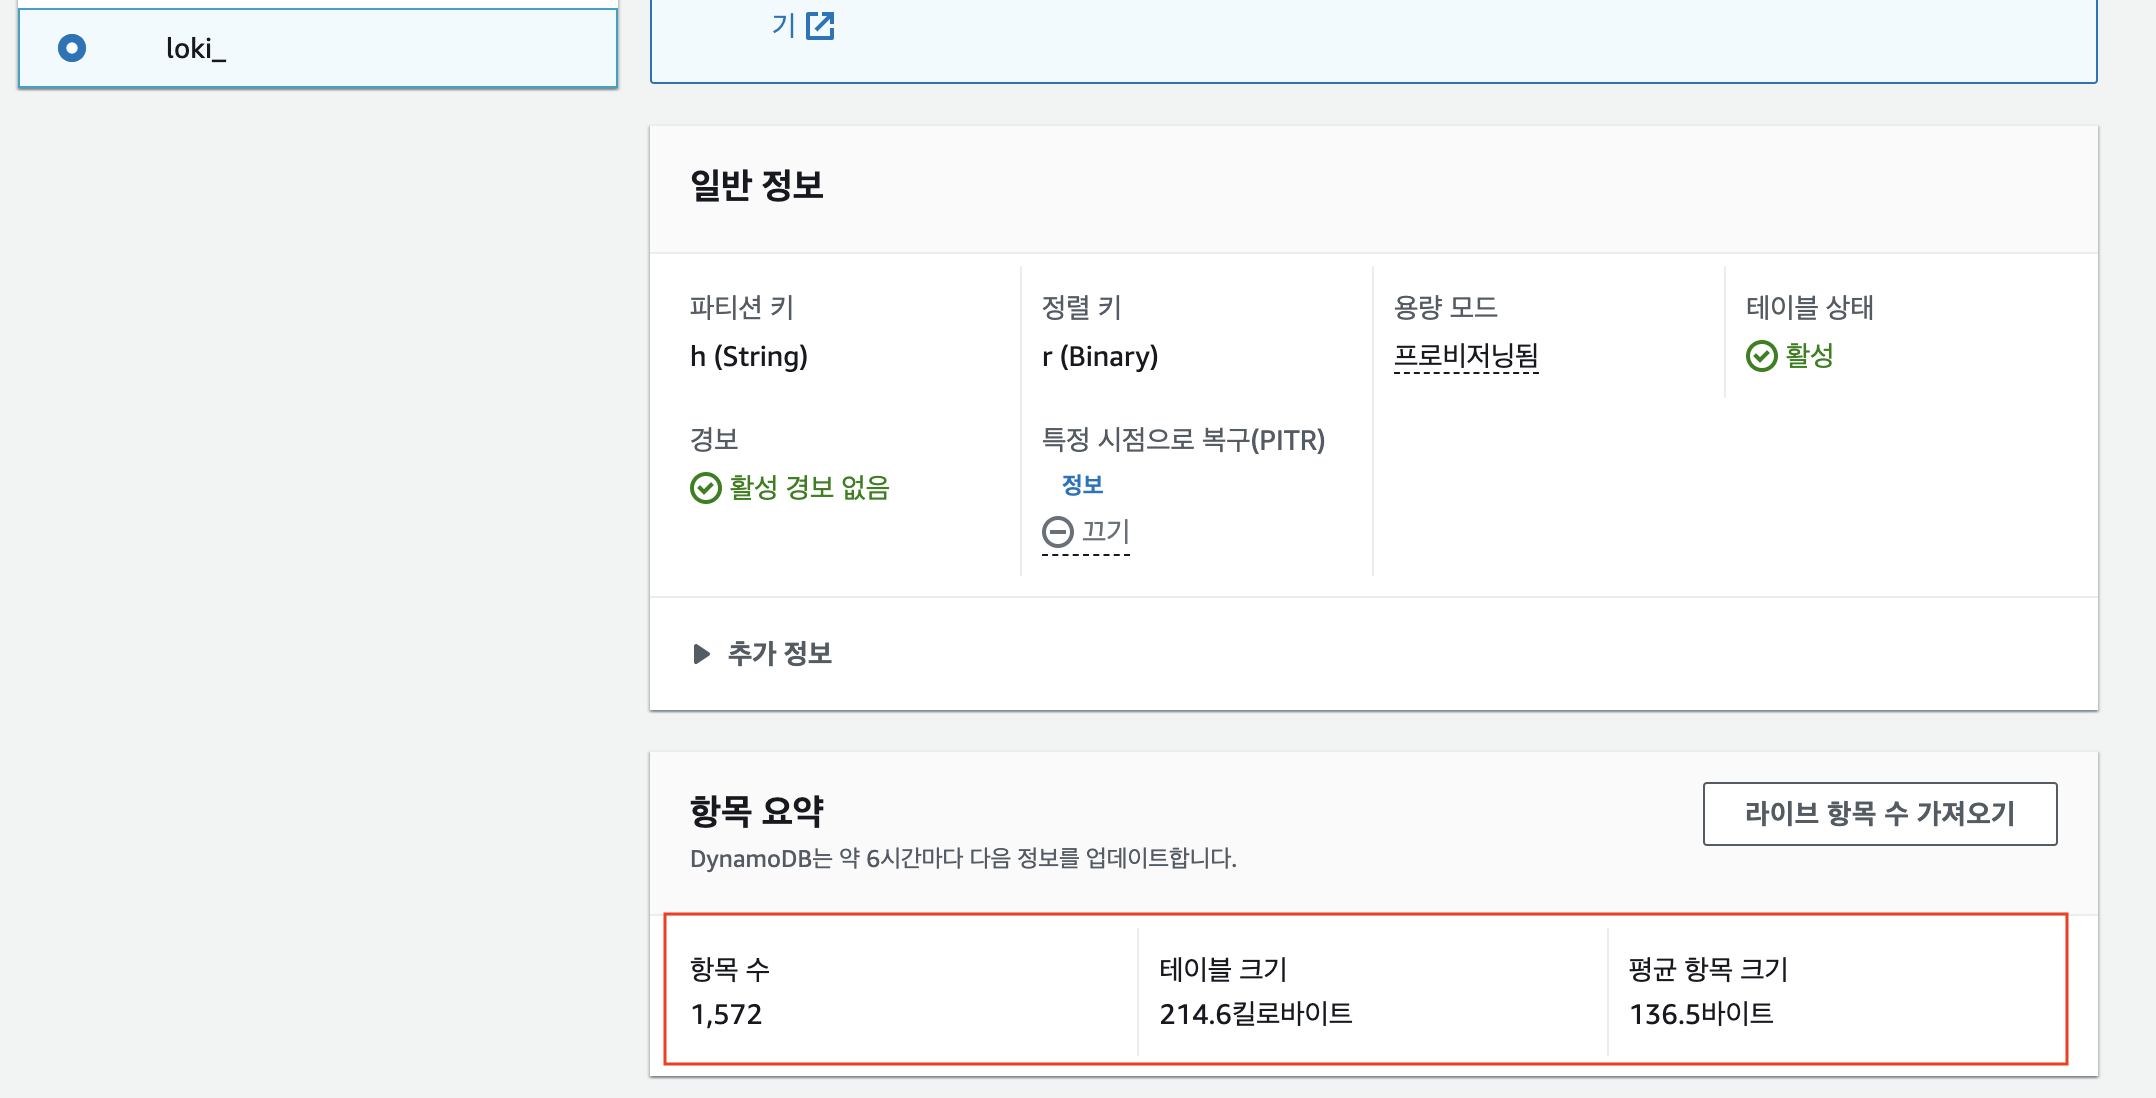
필자의 경우 에러 메세지를 기반으로 소스 코드를 분석했다. 결론적으로는 DynamoDB Struct에 Region 설정값이 없어서 생긴 오류였다. 코드 분석 과정은 다음과 같다.

에러 메세지을 찾아 확인하니 ValidateEndpointHandler 함수에서 발생하는 에러였다. 해당 함수는 AWS SDK의 일부로 AWS 서비스 요청에 대한 엔드포인트와 리전 정보를 검증하는 함수이다.

code-dynamo.png

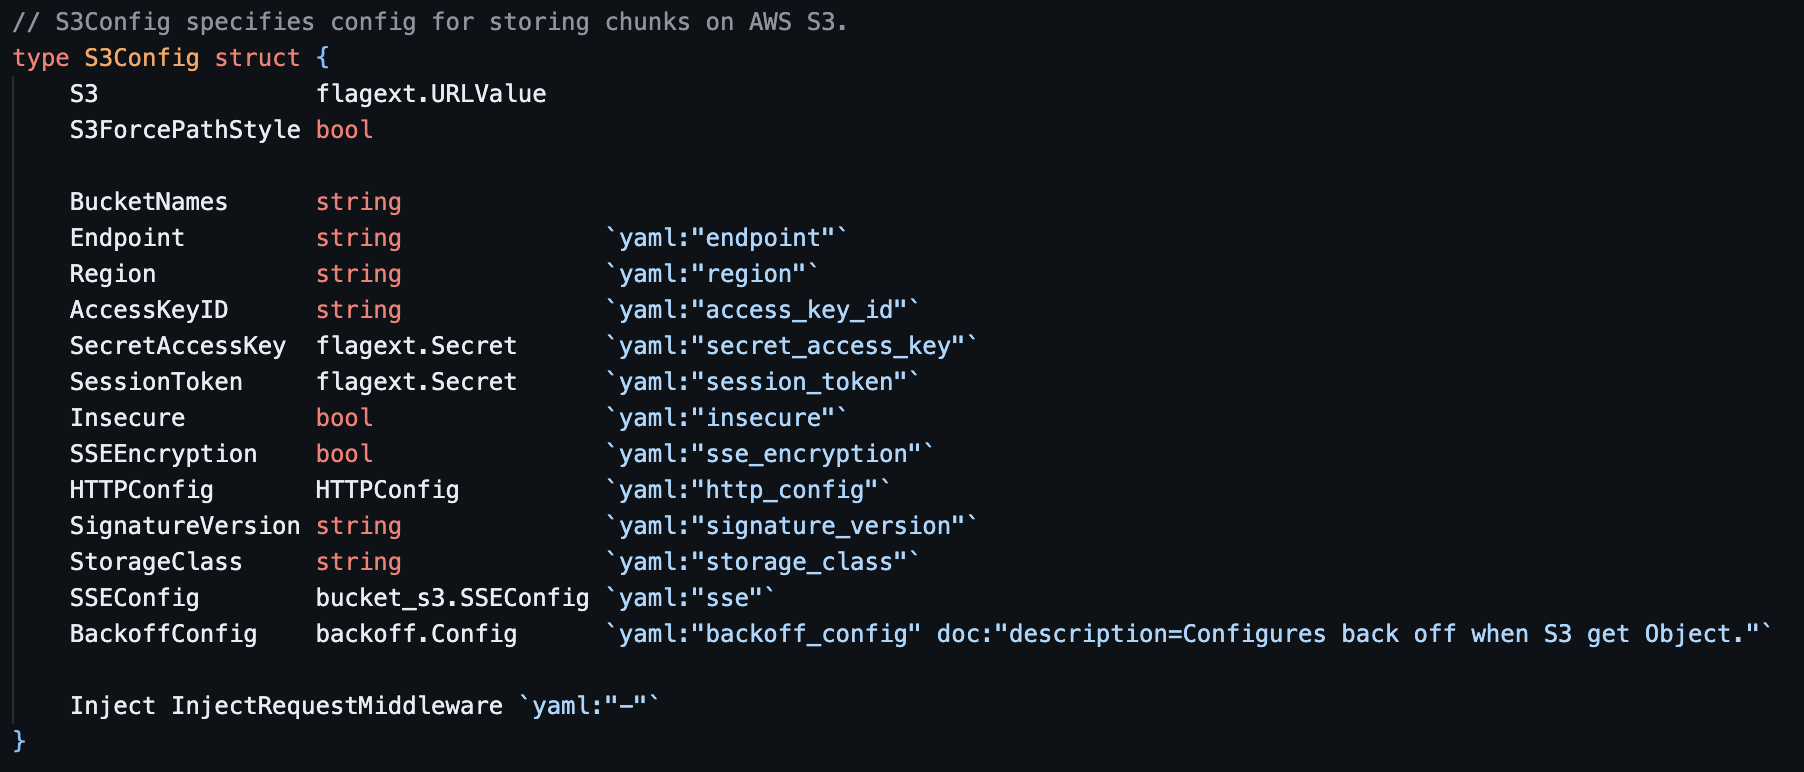
해당 함수의 호출은 AWS 클라이언트를 생성하고, 이를 사용하여 서비스 요청을 시작할 때 발생한다. 각 스토리지 S3, DyanmoDB 클라이언트 구조체는 다음과 같은데 S3에는 region이 있지만, Dynamodb 에서는 해당 변수가 없었다.

code-s3.png

아래와 같이 DynamoDB는 변수 dynamdb.dynamodb_url 이 Endpoint 및 시크릿 키를 입력받도록 되어 있다. 이는 Loki 버전 업데이트 전(Version 2.0 이하)의 변수 입력과 동일하다. 필자가 추정하건데 차트와 연동하여 스토리지 변수 설정 부분은 S3, GCS, Azure 만 업데이트되어 있는 것 같다.

dynamodb-code.png

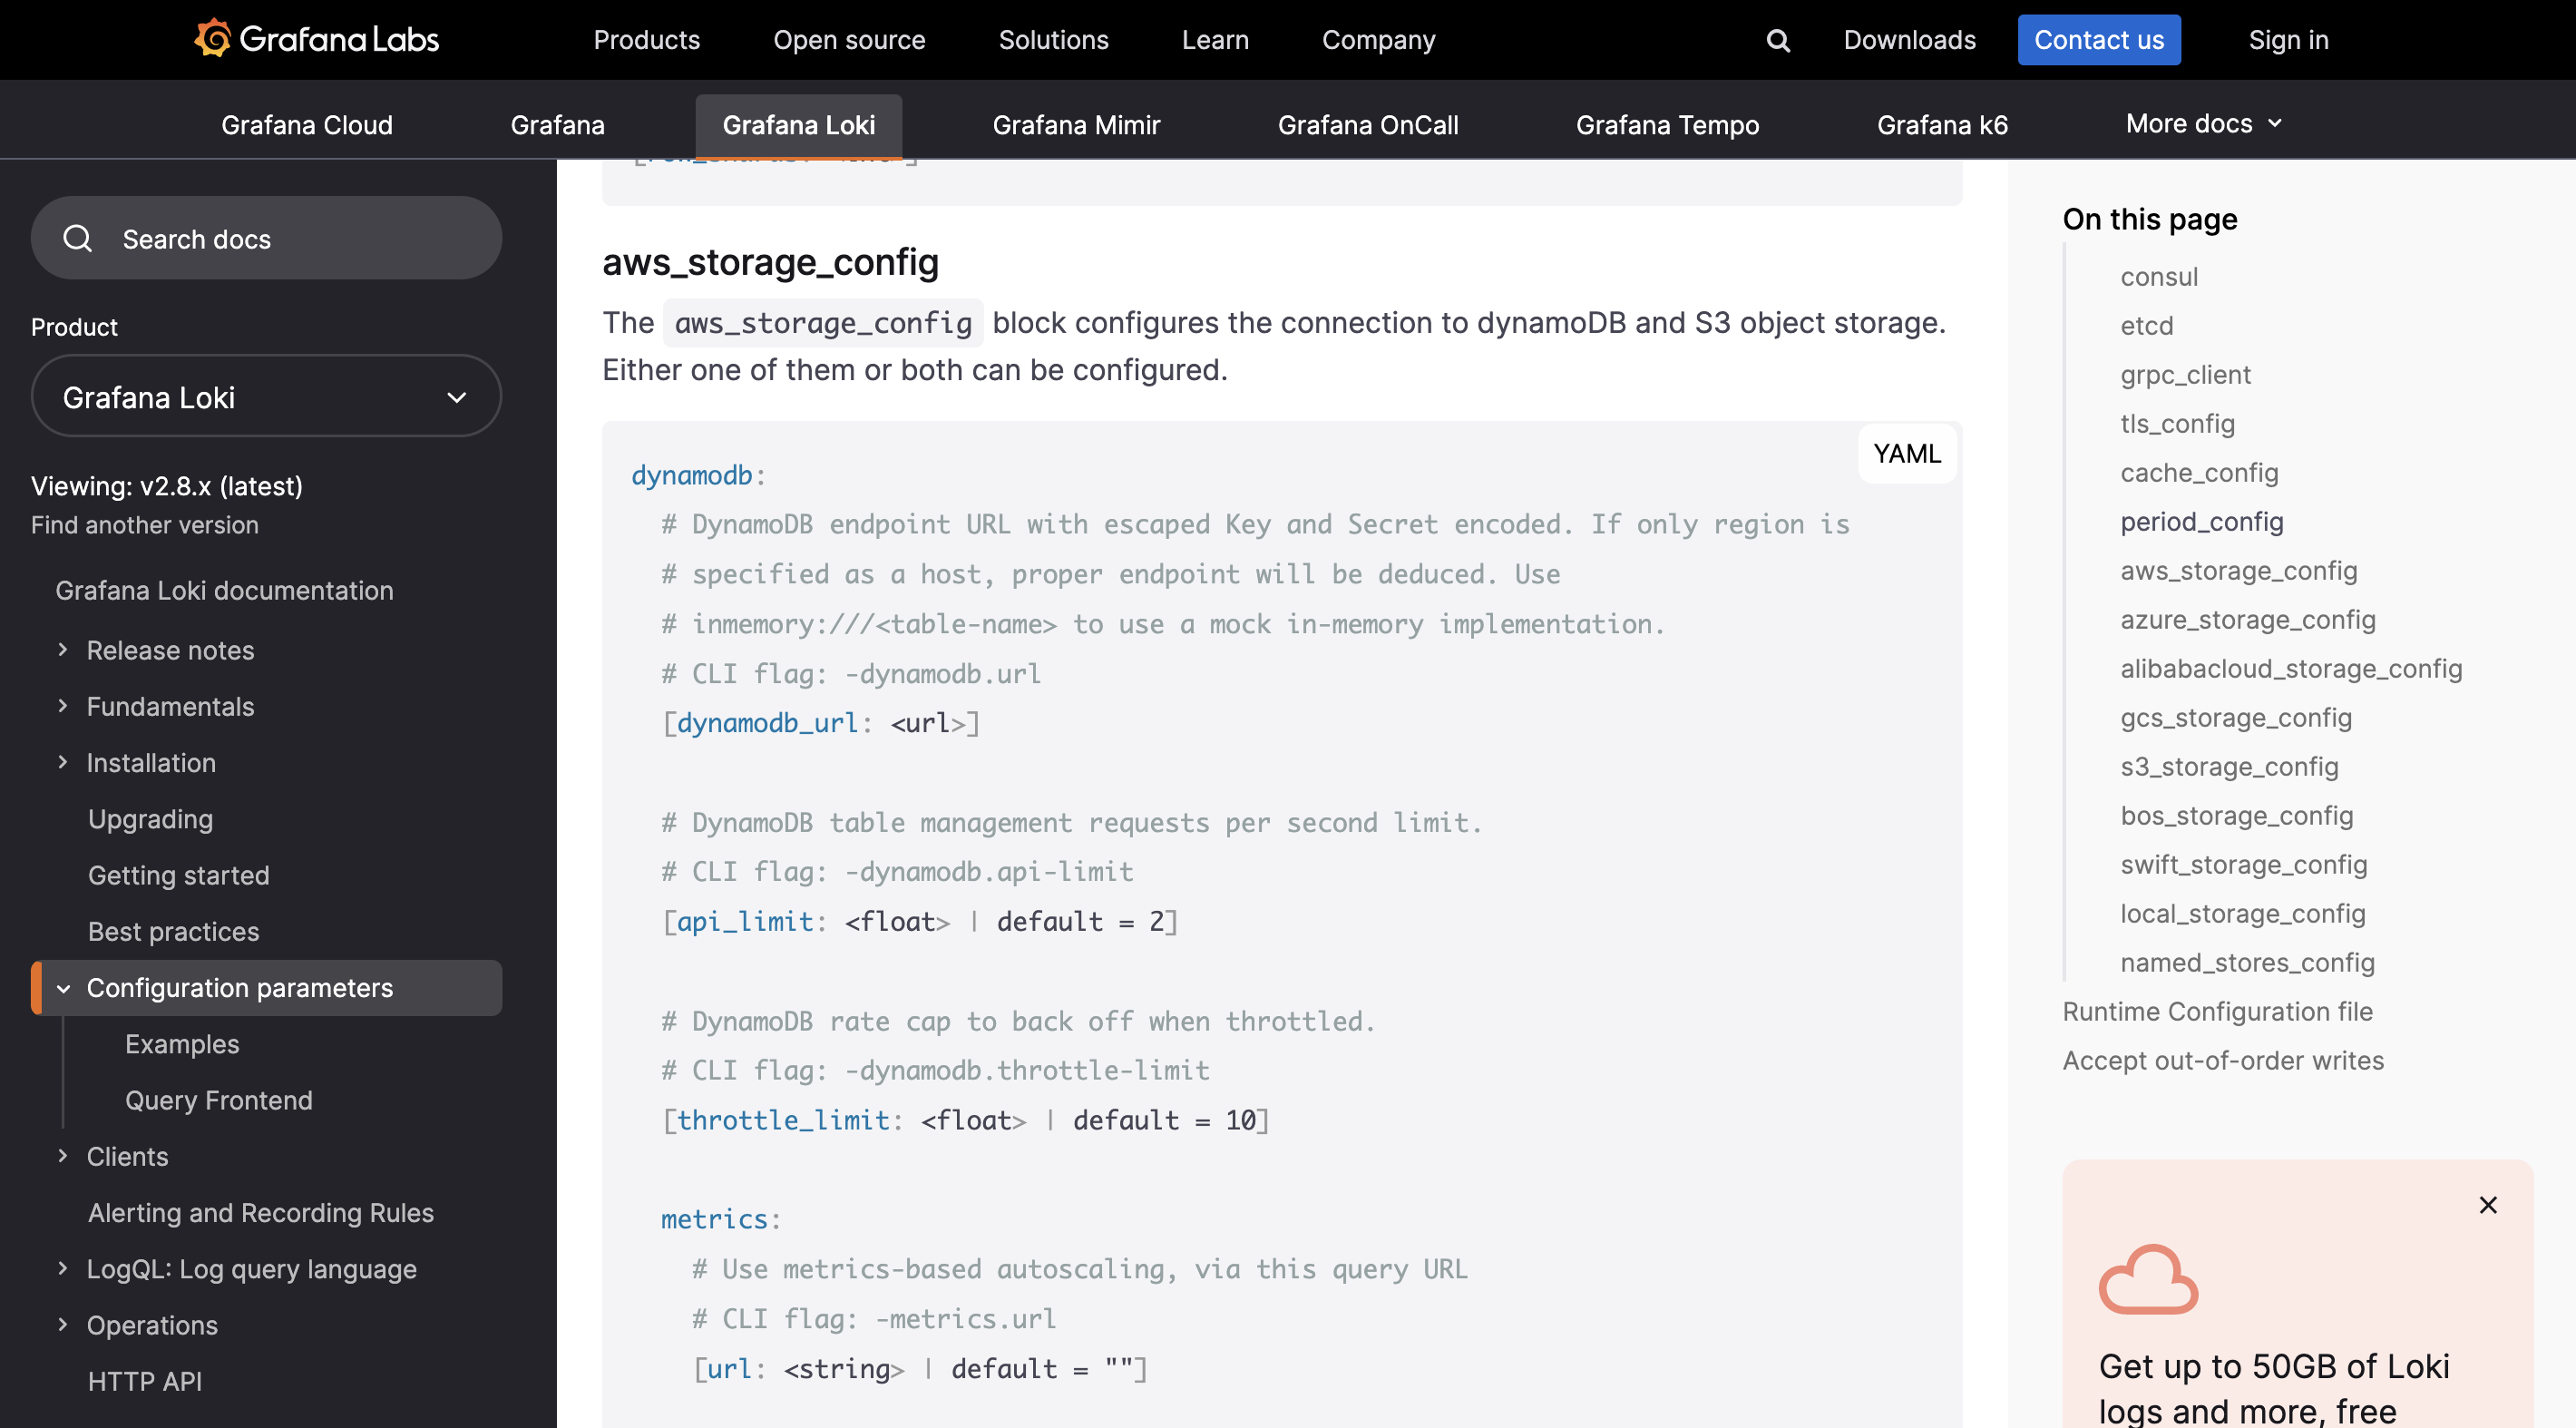
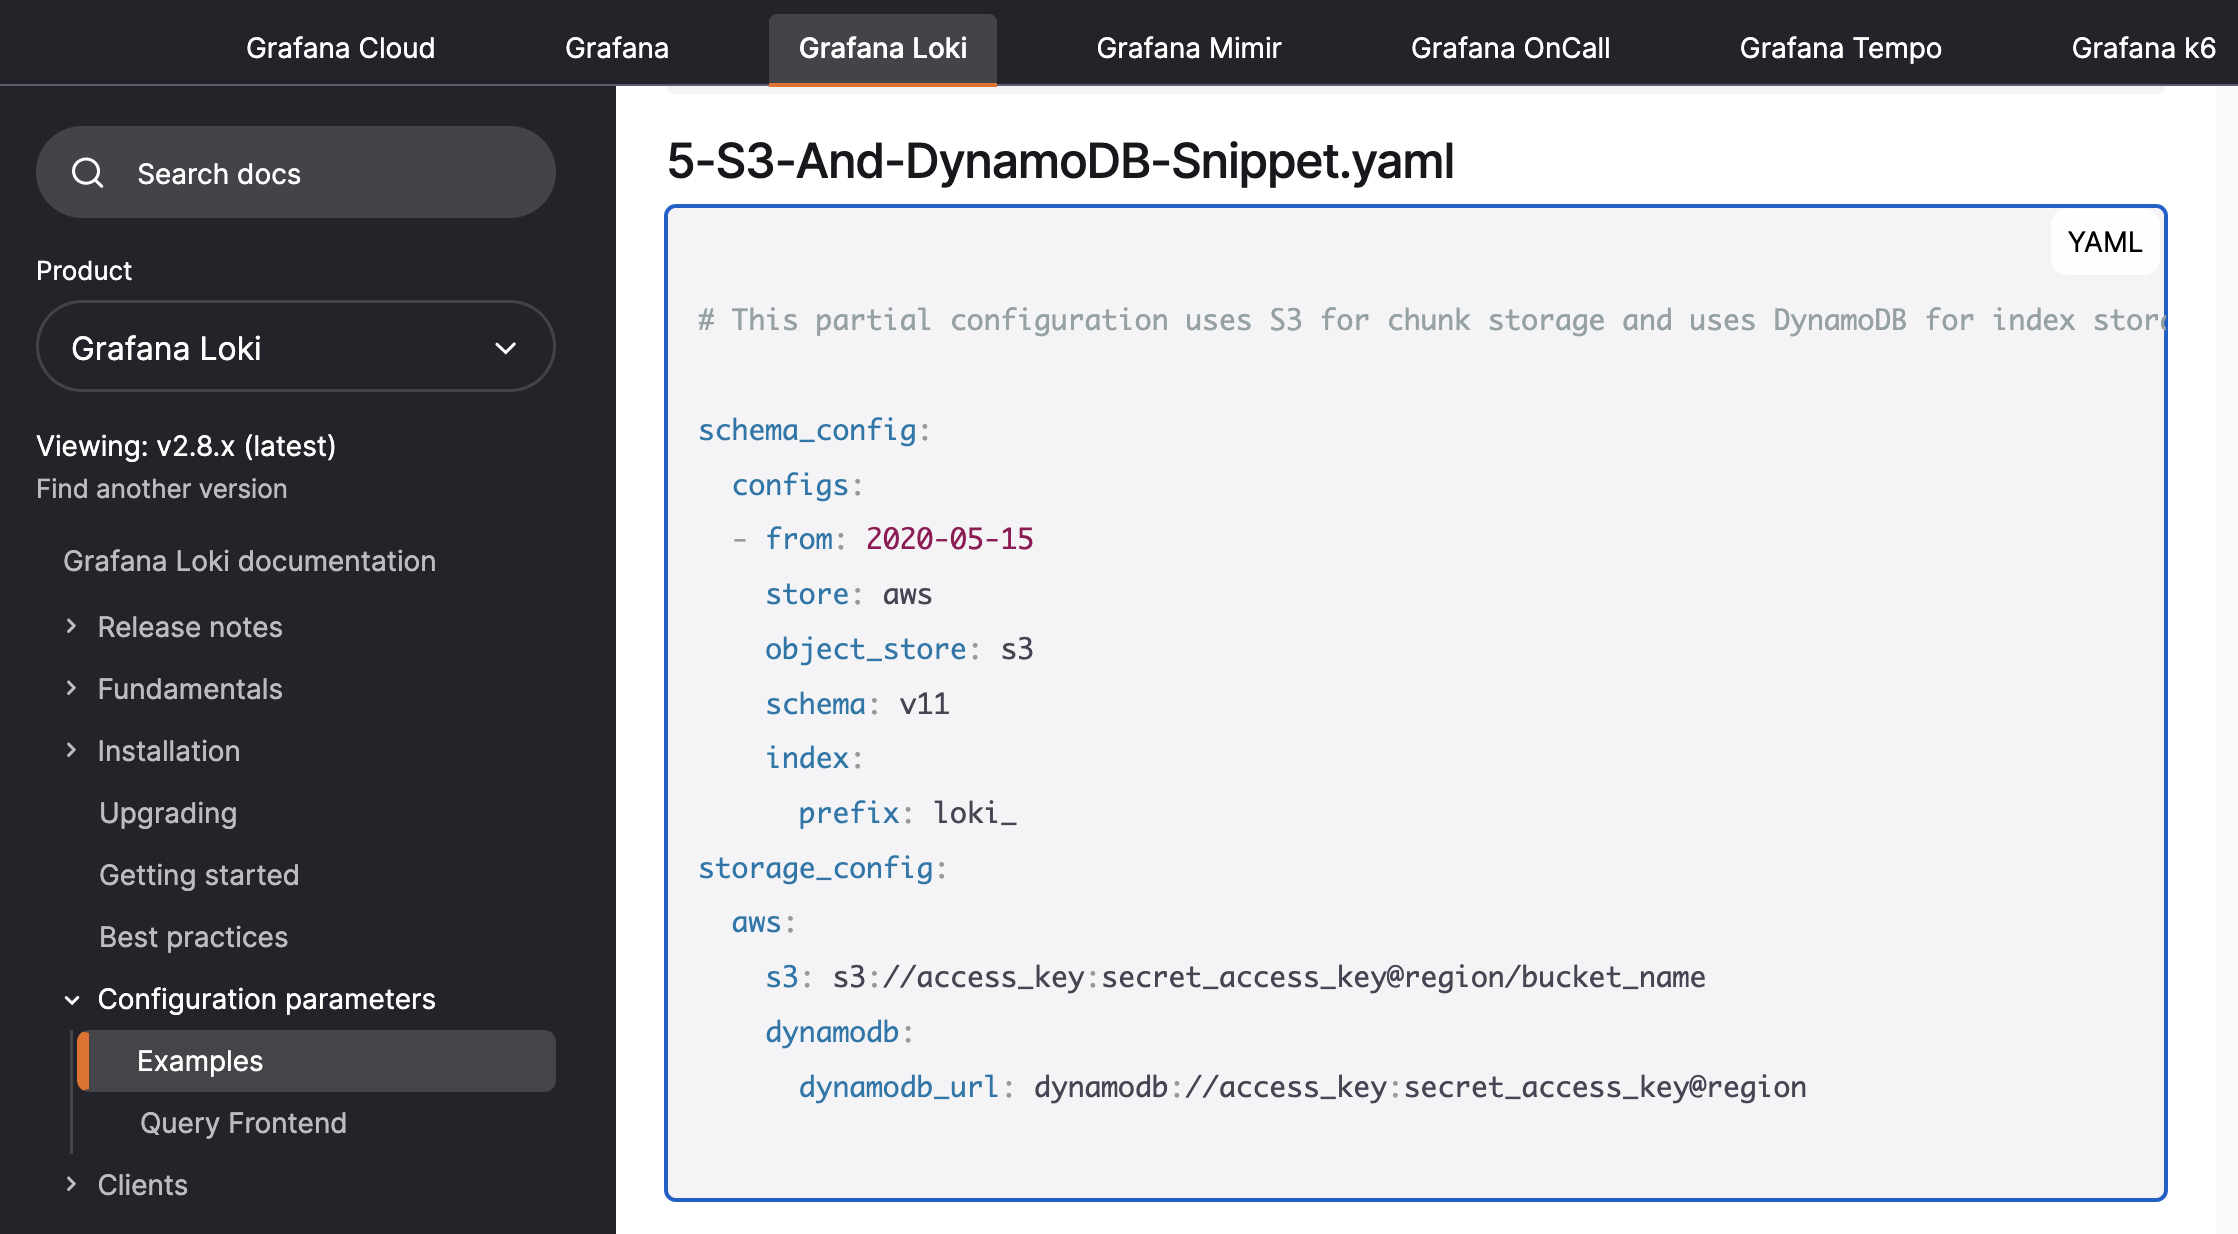
오류 해결은 간단하다. Loki 스토리지 예제를 참고하여 DynamoDB_URL에 Region 과 AWS 키 값 형식을 확인하며 차트에 반영하면 된다. Loki 스토리지 예제는 다음과 같이 확인할 수 있었다.

<a href="https://grafana.com/docs/loki/latest/configuration/examples/">https://grafana.com/docs/loki/latest/configuration/examples/</a>

https://grafana.com/docs/loki/latest/configuration/examples/

이를 반영하여 최종적으로 수정한 차트는 다음과 같다.

 1
 2
 3
 4
 5
 6
 7
 8
 9
10
11
12
13
14
15
16
17
18
19
20
21
22
23
24
25
26
27
28
29
30
31
32
33
34
35
36
37
38
39
40
41
42
# values.yaml
Loki:
...
...
config: |
  ....  
	table_manager:
	      retention_deletes_enabled: true
	      retention_period: 336h
	      index_tables_provisioning:
	        provisioned_write_throughput: 5
	        provisioned_read_throughput: 5
	      chunk_tables_provisioning:
	        provisioned_write_throughput: 5
	        provisioned_read_throughput: 5
   ...
# -- Check https://grafana.com/docs/loki/latest/configuration/#schema_config for more info on how to configure schemas
  schemaConfig: 
    configs:
    - from: "2022-01-11"
      store: aws
      object_store: s3
      schema: v12
      index:
        prefix: loki_
  ...
  # -- Check https://grafana.com/docs/loki/latest/configuration/#ruler for more info on configuring ruler
  rulerConfig: {}
  # -- Structured loki configuration, takes precedence over `loki.config`, `loki.schemaConfig`, `loki.storageConfig`
  structuredConfig: {}
  # -- Additional query scheduler config
  query_scheduler: {}
  # -- Additional storage config
  storage_config:
    hedging:
      at: "250ms"
      max_per_second: 20
      up_to: 3
    aws:
      s3: s3://<AWS-ACCESS-KEY>:<AWS-SECRET-KEY>@ap-northeast-2/han-loki
      dynamodb:
        dynamodb_url: dynamodb:///<AWS-ACCESS-KEY>:<AWS-SECRET-KEY>@ap-northeast-2
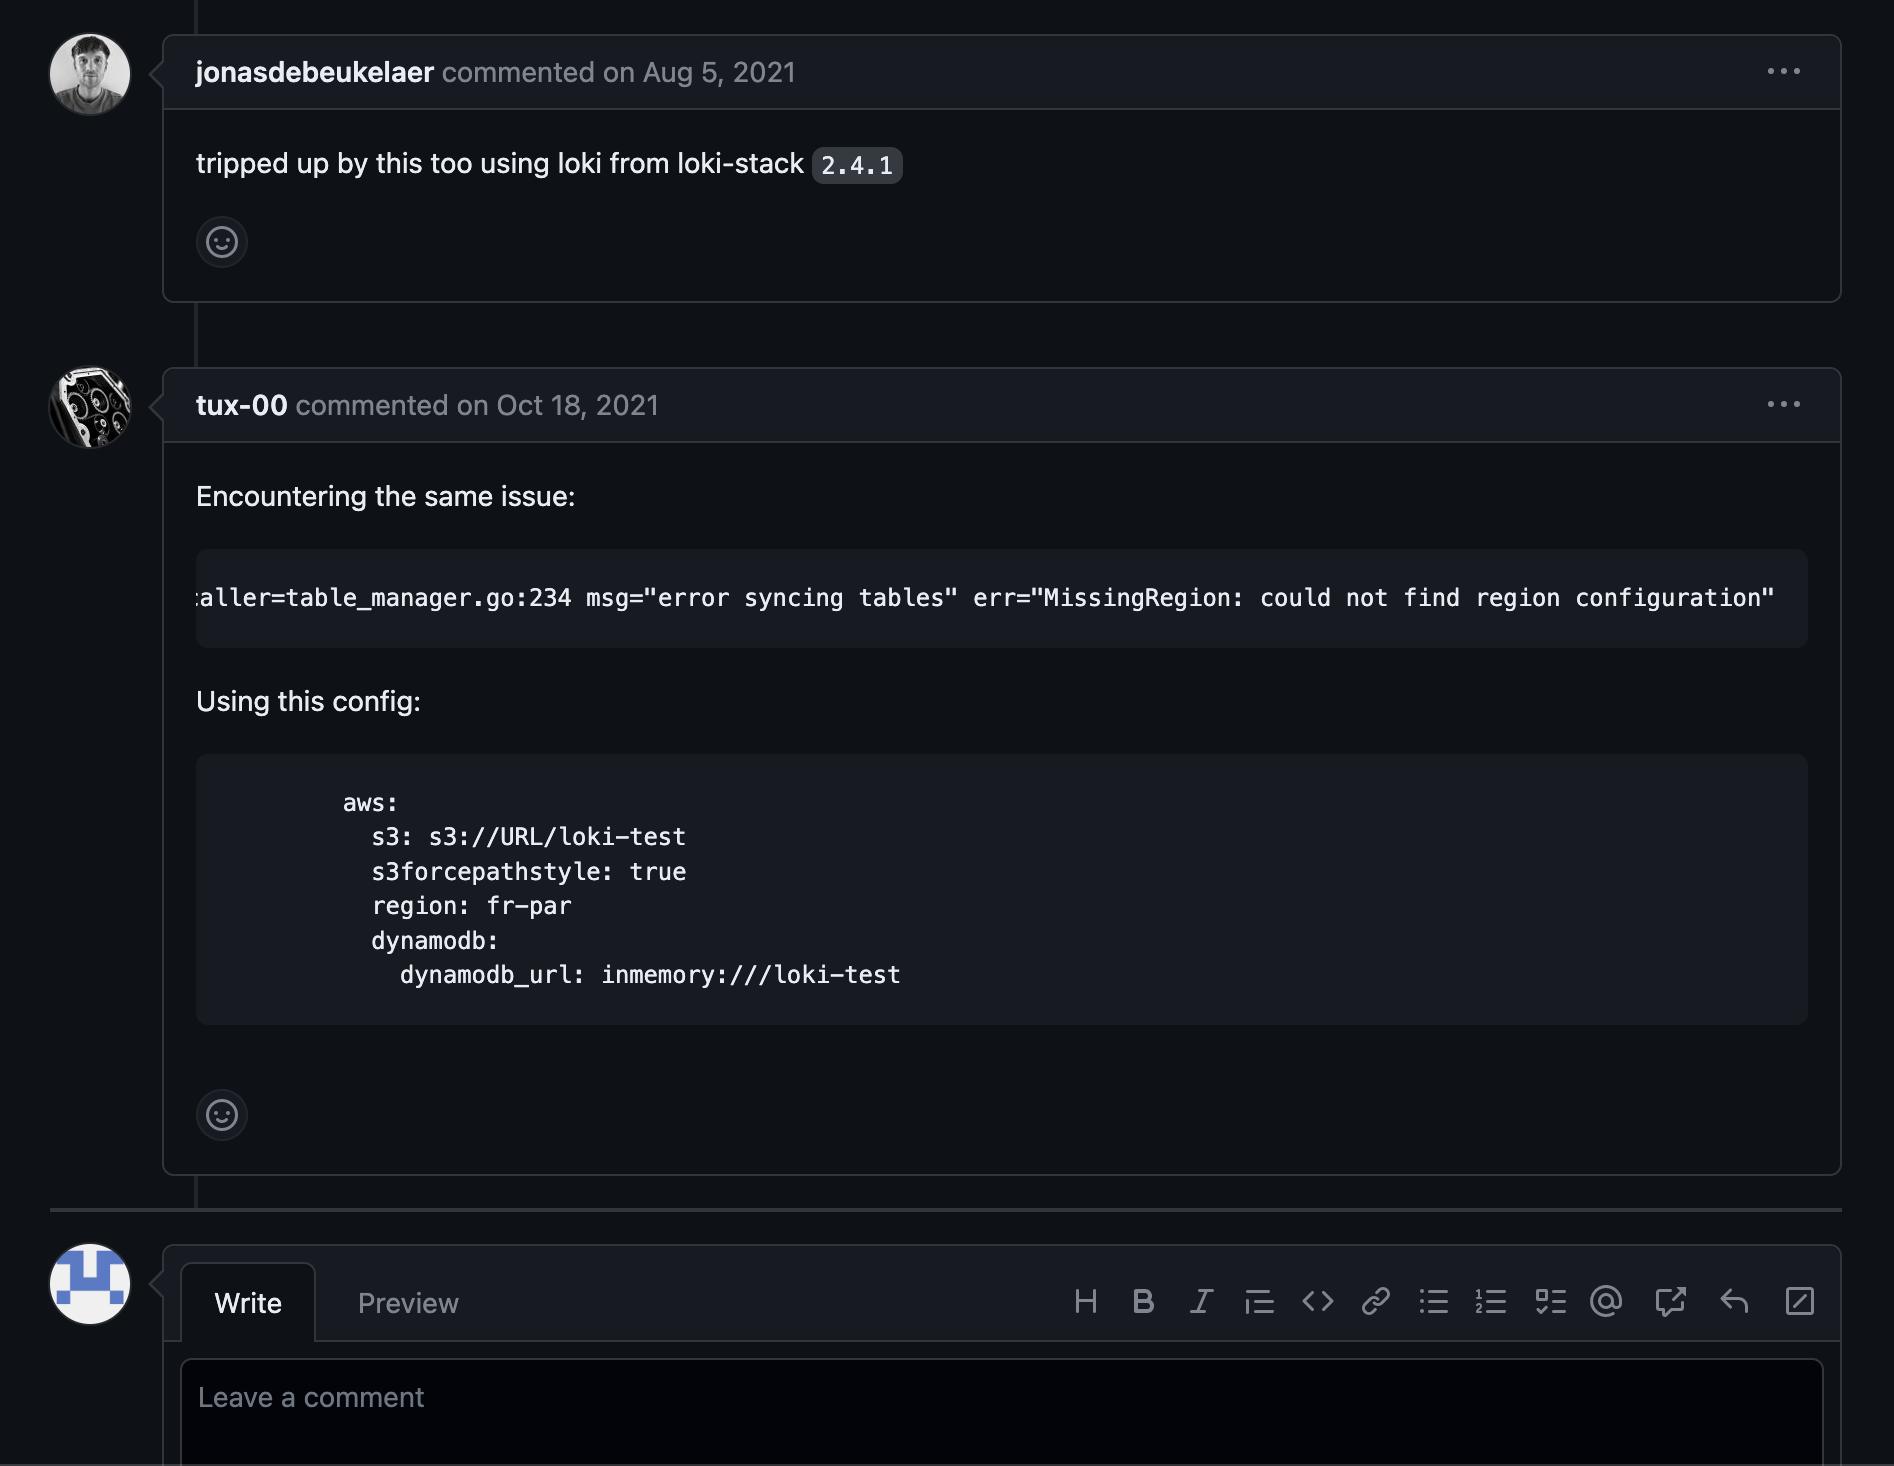
  • 앞선 깃 이슈에서 dynamodb_url에 inmemory:/// 로 변수를 설정하는 것이 있었는데 이는 가상의 인메모리로 구현시 사용된다고 한다. 연동시 헷갈리지 말자
 1
 2
 3
 4
 5
 6
 7
 8
 9
10
11
12
13
14
15
# values-loki.yaml
tableManager:
  enabled: true

test:
  enabled: true

monitoring:
  lokiCanary:
    enabled: true
  selfMonitoring:
    enabled: true

loki: 
  auth_enabled: false
  • Loki Config 부분을 제외하고는 오버라이드가 가능하여 나머지 설정 부분은 다음과 같이 설정하였다.

배포 확인

차트 배포를 통해 연동을 해보자.

1
2
3
4
kubectl create ns loki
helm repo add grafana https://grafana.github.io/helm-charts
helm repo update
helm install loki grafana/loki -f values.yaml -f values-loki.yaml -n loki --version 4.8.0

배포 후 AWS 콘솔에서 확인하면 S3에는 청크가 DynamoDB에는 인덱스가 저장되는 것을 확인할 수 있다.

S3 Chunk 확인

fake-.png

loki-success-s3.png

DynamoDB 인덱스 조회 확인

index-.png

성공이다..! 돌고 돌아 공식 문서에서의 예제로 연동에 성공하였다. 헬름 차트 랜더링과ㅊ 파라미터 변수의 예제를 꼭 확인하도록 하자!

운영시 고려사항

배포 과정에서 고려사항이 있어 추가로 남겨둔다.

스토리지 사용 비용

첫 쨰로 비용이다. DynamoDB 연동시 기본 읽기용량이 100, 쓰기용량이 25로 설정되어 있다. 비용 계산를 확인 하자면 다음과 같다.

한국 DynamoDB 비용

  • 쓰기 요청 유닛(WRU): 1,000,000 건당 $1.3556
  • 읽기 요청 유닛(RRU): 1,000,000 건당 $0.271

기본 읽기용량이 100, 쓰기용량이 25로 설정된 경우, 용량 단위에 대한 실제 요청 수를 알아야 한다.

예를 들어, 시간당 10,000건의 쓰기 요청과 50,000건의 읽기 요청이 있다고 가정하겠다.

  1. 쓰기 요청 비용: 10,000 WRU x ($1.3556 / 1,000,000) = $0.013556
  2. 읽기 요청 비용: 50,000 RRU x ($0.271 / 1,000,000) = $0.01355

총 비용은 $0.013556 + $0.01355 = $0.027106 (1h) 이다.

운영 환경에서 배포시 시스템 규모를 파악하여 쓰기 및 읽기 요청에 따라 용량을 설정하도록 하자. 용량 설정은 위 차트에서의 table_manager 에서 설정이 가능하다. 필자는 5로 설정했었다.

 1
 2
 3
 4
 5
 6
 7
 8
 9
10
11
12
13
14
15
16
# values.yaml
Loki:
...
...
config: |
  ....  
	table_manager:
	      retention_deletes_enabled: true
	      retention_period: 336h
	      index_tables_provisioning:
	        provisioned_write_throughput: 5
	        provisioned_read_throughput: 5
	      chunk_tables_provisioning:
	        provisioned_write_throughput: 5
	        provisioned_read_throughput: 5
   ...